
WTI Weekly: Key Resistance Holds Early Week Before Pullback Toward Key Support.

Petrotahlil -
- A meaningfully lower open in Sunday’s auction resulted in balance trade Monday below last week’s key resistance, 29.13s.
- A pullback developed to 23.54s into Wednesday’s trade as sellers trapped and retracement unfolded to 28.36s into Thursday’s OPEC+ announcement.
- Buyers trapped amidst sell excess before resumption of the pullback developed to 22.50s near key support ahead of week’s end.
- The near-term bias is sell-side barring failure of 26.50s as resistance.
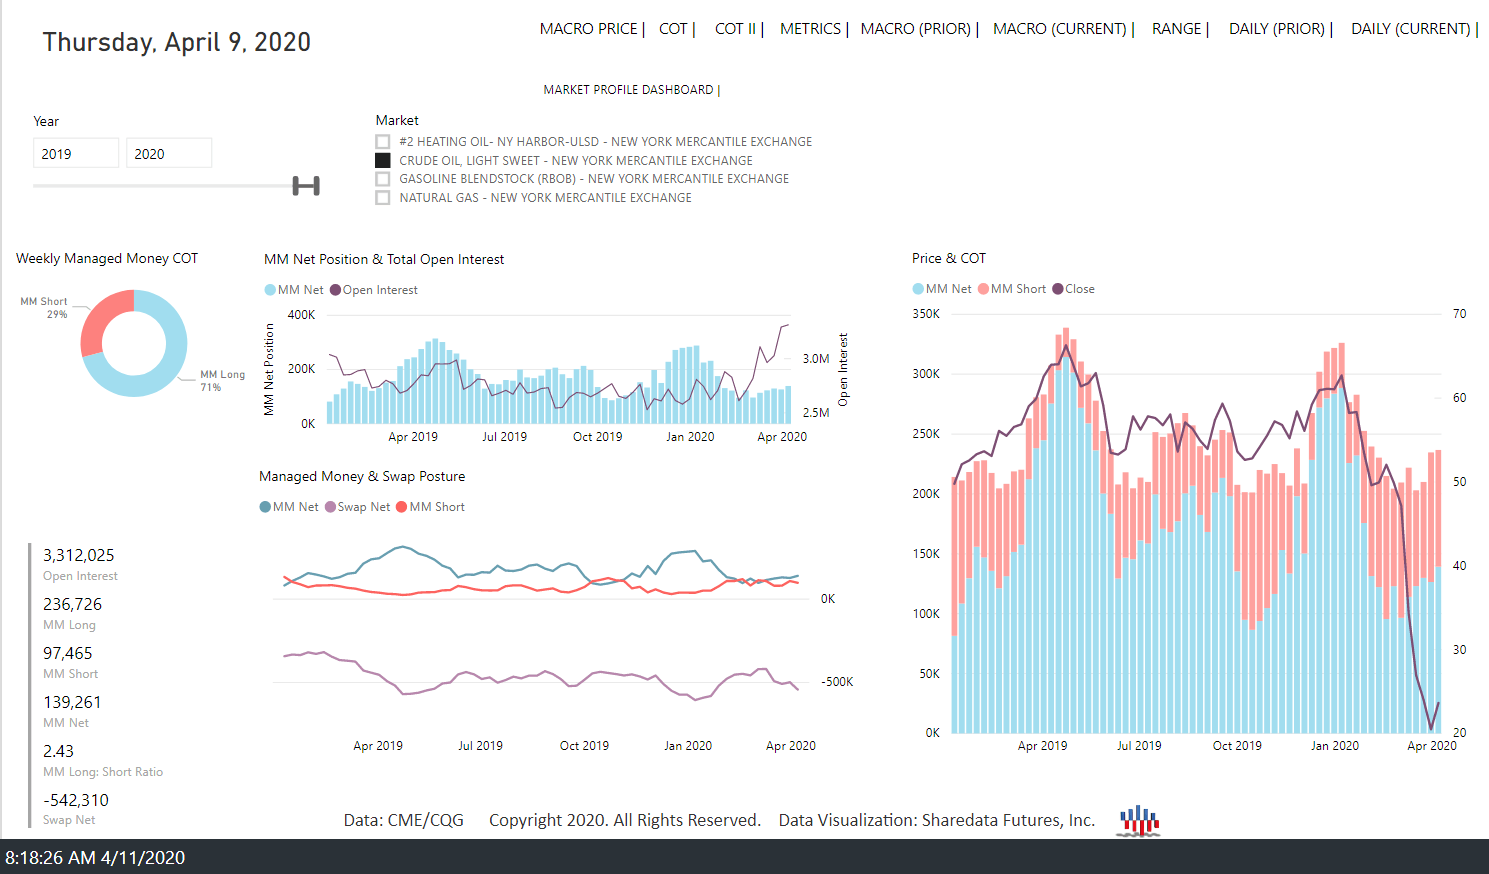
- This week’s leveraged capital posture saw a small increase in net length.
As noted in last week’s WTI Weekly, the primary expectation for this week was for price discovery higher, barring failure of 22s as support. This expectation did not play out as the key support area, 29s-30s, held early week before a pullback to 23.54s developed into mid-week. Rotation higher then developed to 28.36s into Thursday’s OPEC+ announcement where buyers trapped amidst sell excess. An aggressive sell-off developed to 22.50s near key support ahead of Thursday’s close, settling at 22.76s.
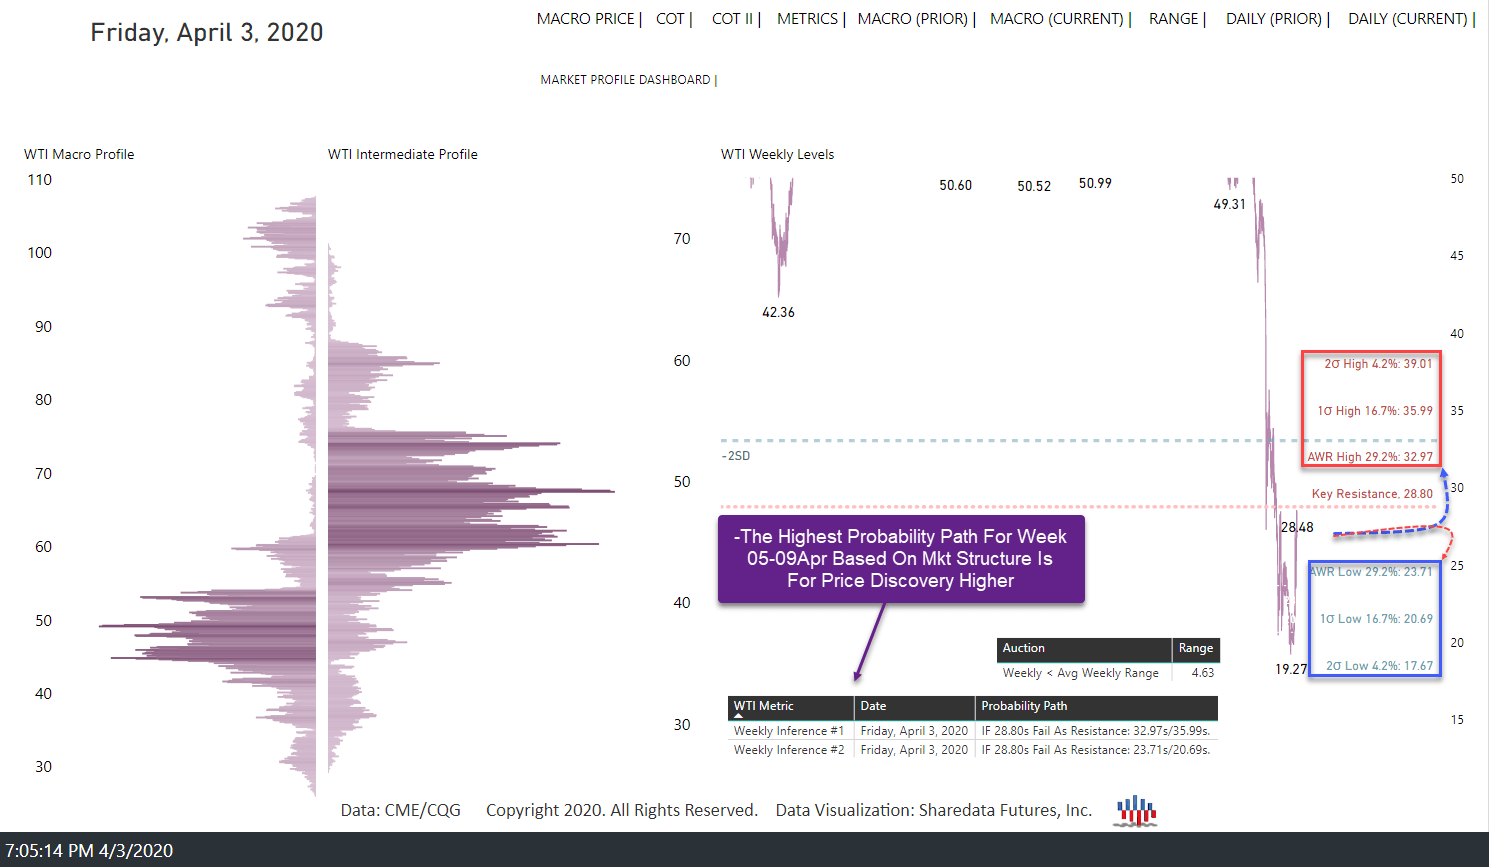
05-09 April 2020
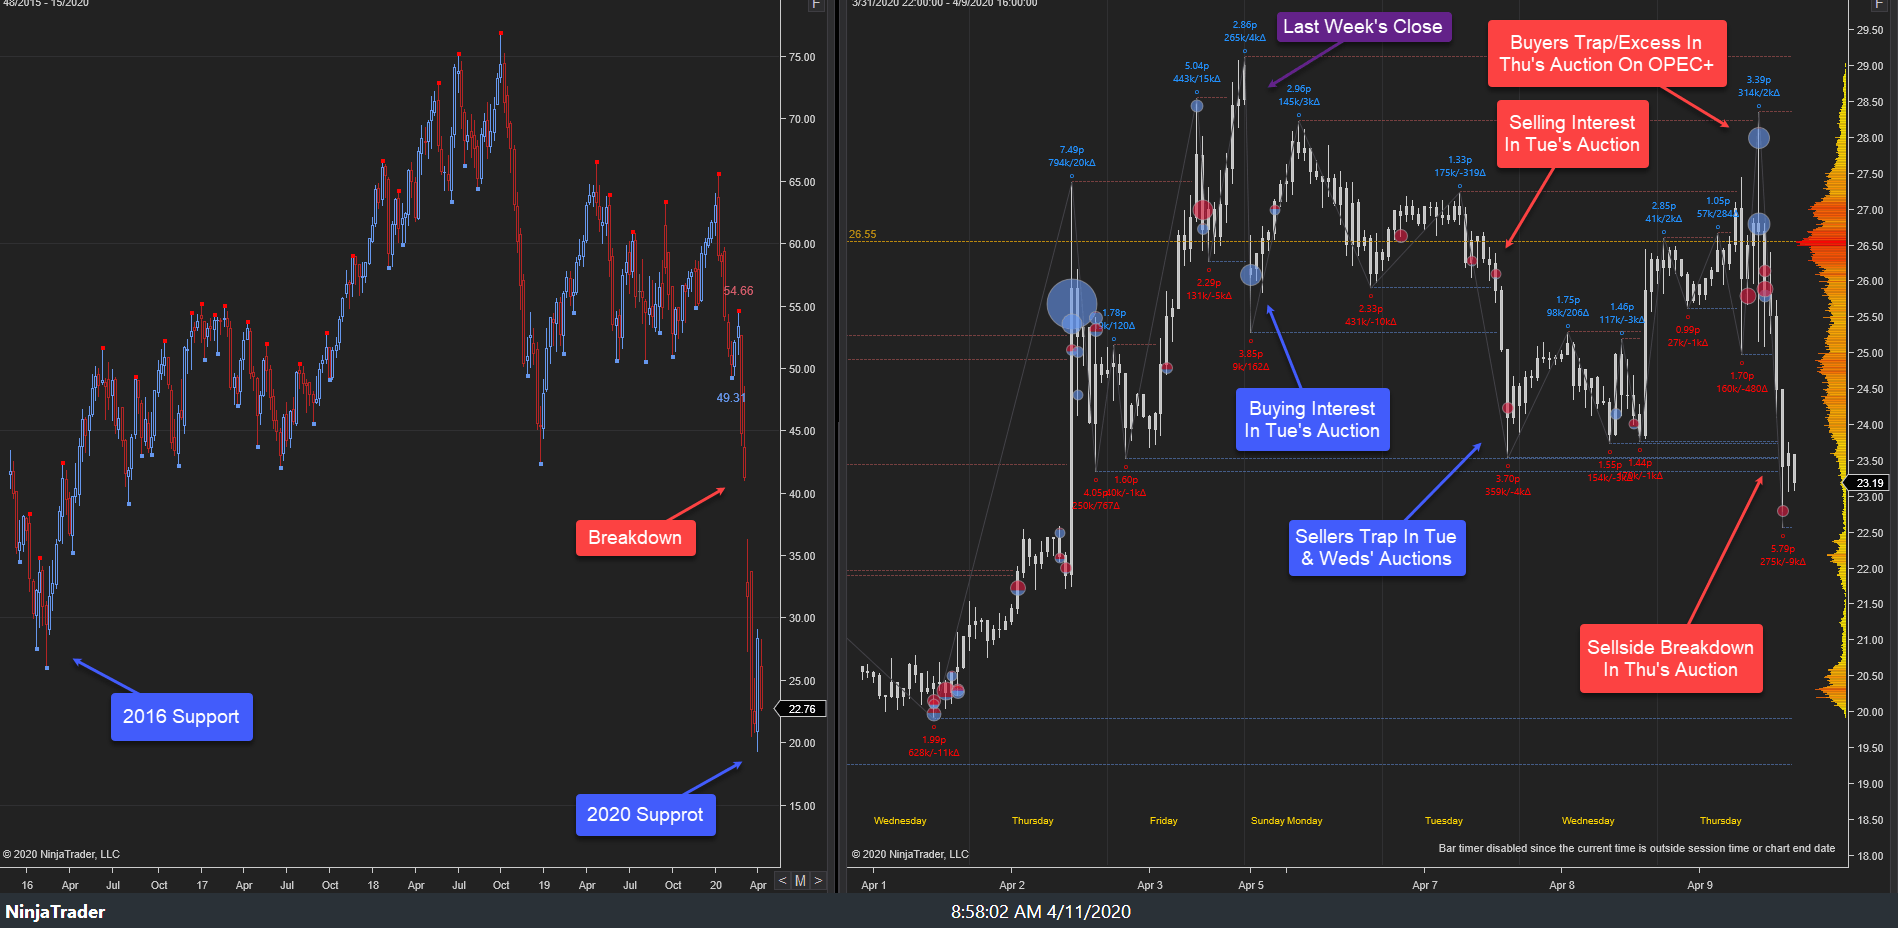
This week’s auction saw a lower open in Sunday’s auction as last week’s late buyers failed to hold the auction. The pullback developed to 25.28s where buy excess formed as buying interest emerged, 26.09s. Rotation higher developed to 28.25s as balance developed, 28.25s-25.91s, below key resistance into Monday’s NY close. Narrow balance continued in Tuesday’s trade as selling interest emerged, 26.63s/26.29s/26.10s, before price discovery lower unfolded to 23.53s near Shareadata’s average weekly range low target as selling interest emerged again, 24.21s, into Tuesday’s NY close.
Buy excess developed as Tuesday’s late sellers failed to hold the auction, developing balance, 23.53s-25.31s, into Wednesday’s auction. Balance continued through the EIA release (+15.1 million vs. +9.2 million expected) before selling interest emerged, 24.01s. Wednesday’s late sellers trapped as OPEC+ production cut narratives emerged, driving price aggressively higher to 26.47s into Wednesday’s NY close. Balance developed, 26.47s-25.62s, before both failed buy-side and sell-side breakouts developed on the release of OPEC+ meeting results. Sellers trapped, 25.80s, driving price higher to 28.36s. Buyers trapped, 28s, amidst sell excess as aggressive price discovery lower developed to 22.57s near key support, ahead of Friday’s close, settling at 22.76s.
This week’s primary expectation was for price discovery higher, provided 22s held as support. This probability path did not play out as a key resistance held early week before pullback trade developed to 22.58s into the week’s end. This week’s rotation (578 ticks) traded above the average weekly range expectancy (463 ticks).
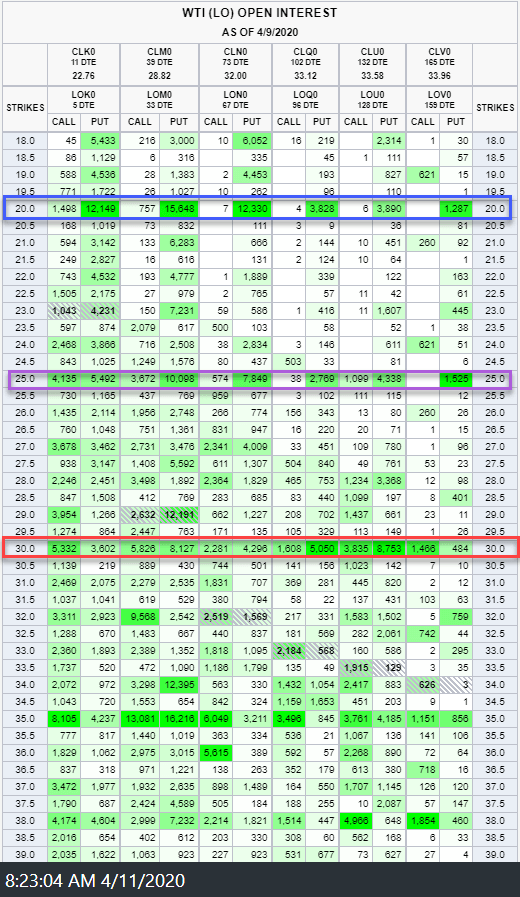
As noted in recent weeks, the selloff to 20.52s three weeks ago was likely a momentum extreme (both in amplitude and volume). Price extremes generally follow momentum extremes. This week’s failed breakdown to 19.28s may serve as that price extreme. It is worth noting that a “Put Wall” has persisted at the 20 strike as well as the 25 strike, ultimately resulting in further adjustment higher toward the next option wall area above, 29s-30s.
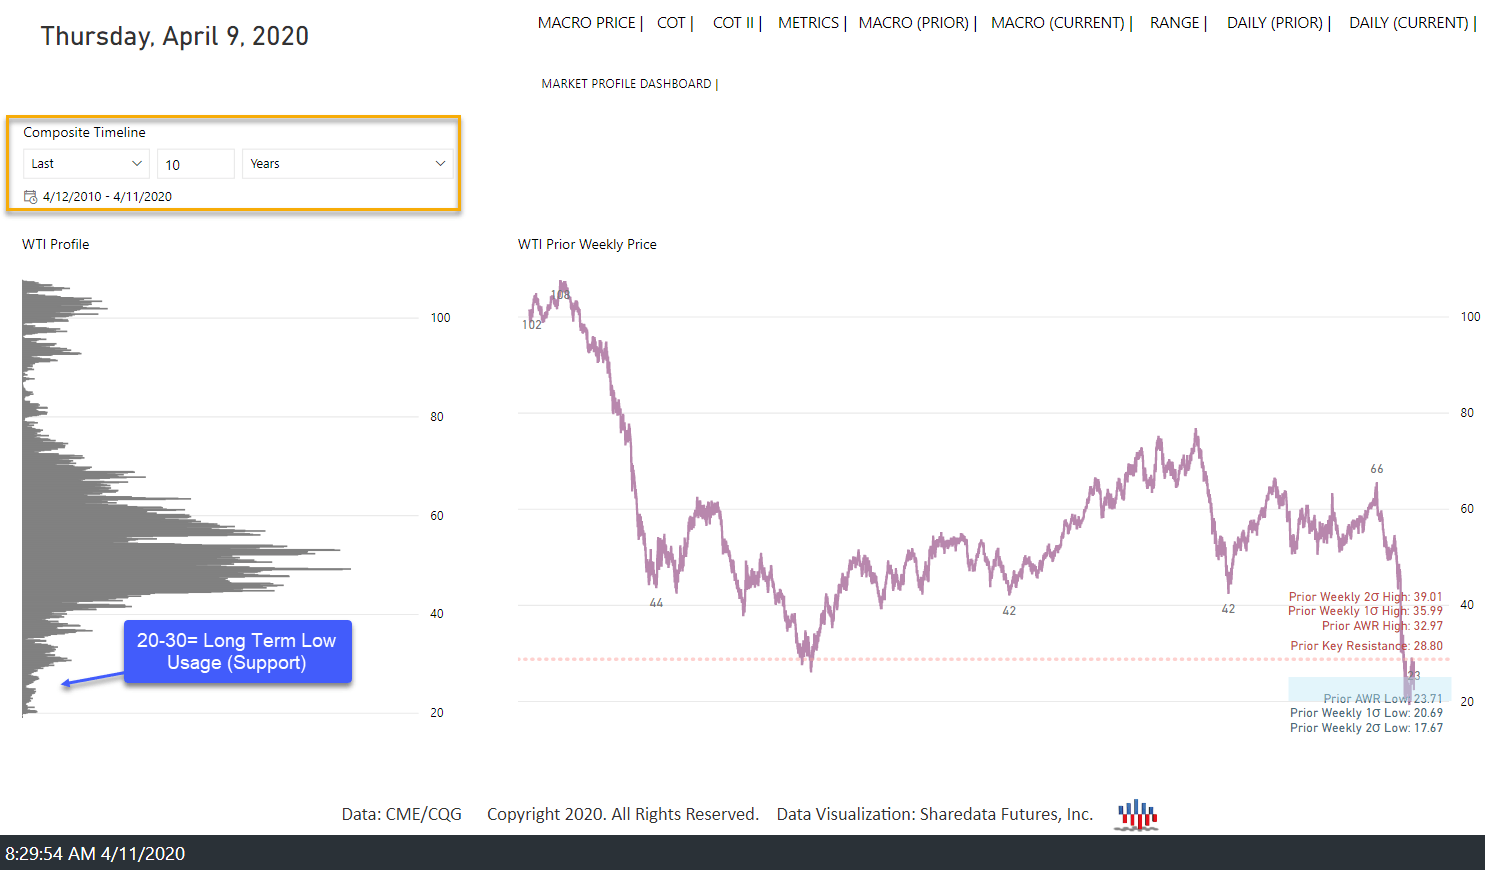
Looking ahead, the primary expectation into next week is that the bulk of risk associated with coronavirus/Russia-Saudi price war is priced in. Focus into next week centers on response to key support, 23s-22s. Buy-side failure at key support will target key demand cluster below, 21s-19.50s, respectively. Alternatively, sell-side failure to drive price lower from this key support area will target key supply clusters overhead, 25.50s-27.50s/28.50s-29.13s, respectively. The near-term bias is sell-side barring failure of 26.50s as resistance. The broader contextual question is: has development of a new, structural support area near twenty-year lows begun?
It is worth noting that market posture warranted caution on the buy-side near the April 2019 high, 66.60s, as Managed Money (MM) long posture peaked there. Similarly, from mid-December 2019 to mid-January 2020, market posture reached similar levels to April 2019 as price traded toward 64s. In both cases, the market saw meaningful corrections. This week’s report shows MM net long posture (+139k contracts), a minor increase from last week as MM short posture also increased (-97k contracts). Within the last five years, for a structural low to develop, MM short posture has had to exceed 100k contracts in confluence with sub-100k MM net long posture.
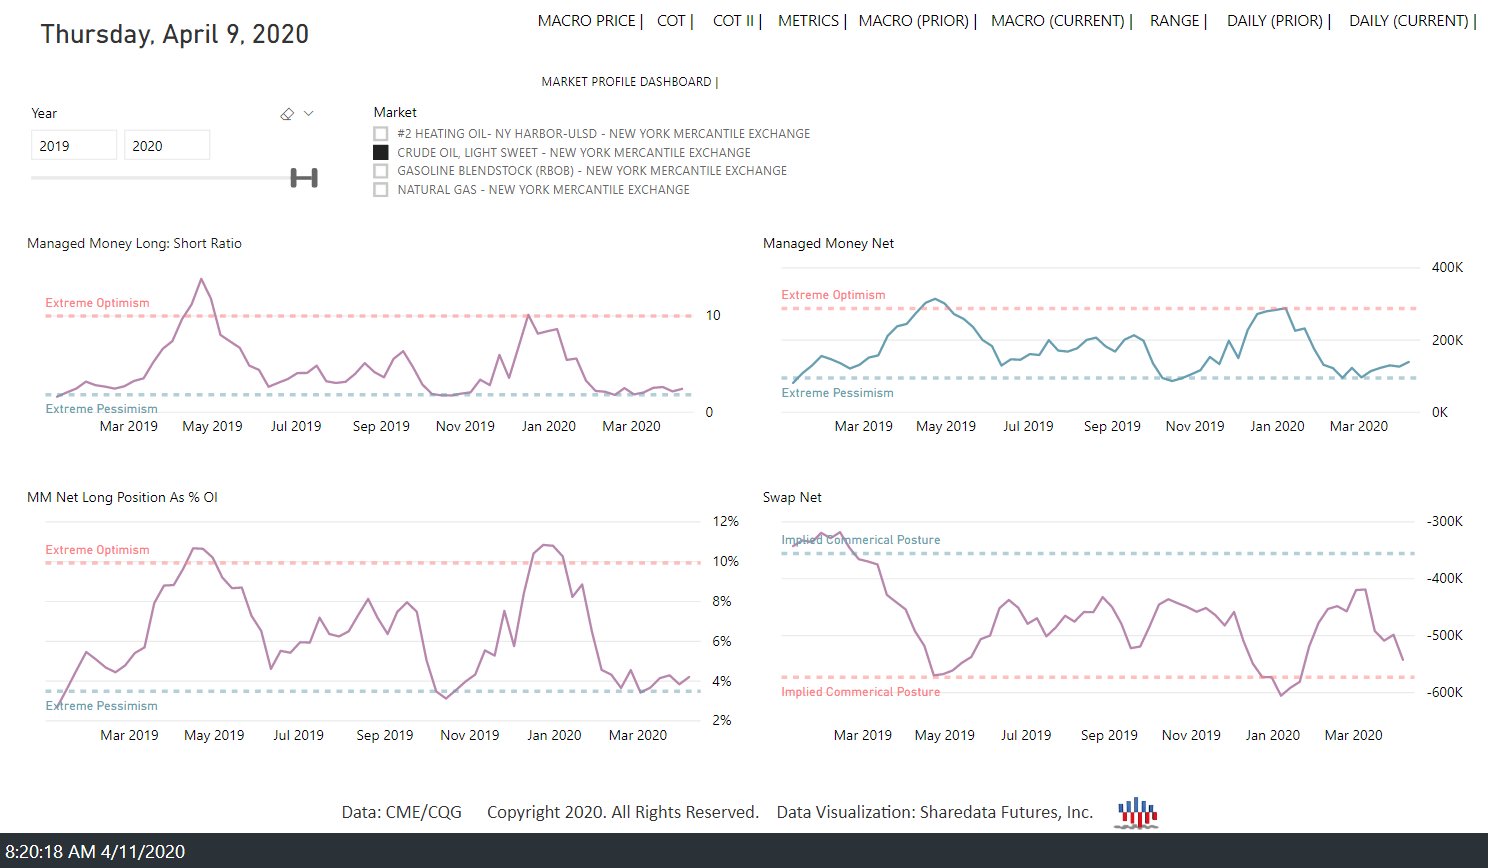
MM long:short ratio, MM net long as % of open interest, and MM net long posture are all at levels of historical extreme pessimism. This development continues as WTI now trades off the major support area in the typically bullish season (January-May). While the market sell-off has been aggressive and historic in duration and amplitude, this occurred as price traded to twenty-year lows and the near-term option “put wall” at the 20 strike. Due to the continued aggressive price movement and dramatic increase in volatility premiums across markets, the response in the coming weeks at this major support will be very significant in the longer term.
The market structure, order flow, and leveraged capital posture provide the empirical evidence needed to observe where asymmetric opportunity resides.
Disclosure: I/we have no positions in any stocks mentioned, and no plans to initiate any positions within the next 72 hours. I wrote this article myself, and it expresses my own opinions. I am not receiving compensation for it (other than from Seeking Alpha). I have no business relationship with any company whose stock is mentioned in this article.